
Automatic Diagnostic Repository
ADR – Automatic Diagnostic Repository (introduced in Oracle 11g) is a system managed repository for storing database alert logs, trace files, and any other diagnostic data previously controlled by any other init.ora parameters.
DIAGNOSTIC_DEST is the base location for all diagnostic directories. There are separate directories for the ASM database and the database (rdbms) instance. This repository is maintained in memory which enables database components to capture diagnostic data at its first failure for critical errors.
- In Oracle 11g, the init.ora parameters like user_dump_dest and background_dump_dest are deprecated. They have been replaced by the single parameter DIAGNOSTIC_DEST which identifies the location of the ADR.
- We can use V$DIAG_INFO view to list some important ADR locations such as ADR Base, ADR Home, Diagnostic Trace, Diagnostic Alert, Default Trace file, etc.
- Structure of ADR Directory is designed in such a way that uses consistent diagnostic data formats across products and instances, and an integrated set of tools enable customers and Oracle Support to correlate and analyse diagnostic data across multiple instances . ADR is a directory structure that is stored outside of the database. It is therefore available for problem diagnosis when the database is down.
- The ADR root directory is known as ADR base. Its location is set by the DIAGNOSTIC_DEST initialization parameter. If this parameter is omitted or left null, the database sets DIAGNOSTIC_DEST upon start-up as follows:
- If environment variable ORACLE_BASE is set, DIAGNOSTIC_DEST is set to the directory designated by ORACLE_BASE.
- If environment variable ORACLE_BASE is not set, DIAGNOSTIC_DEST is set to ORACLE_HOME/log
Note :
Within ADR base, there can be multiple ADR homes, where each ADR home is the root directory for all diagnostic data—traces, dumps, the alert log, and so on—for a particular instance of a particular Oracle product or component. For example, in an Oracle Real Application Clusters environment with Oracle ASM, each database instance, Oracle ASM instance, and listener has an ADR home.
- ADR homes reside in ADR base subdirectories that are named according to the product or component type.
The locations of the various diagnostics directories can be displayed using the below command:
|
1 2 3 4 5 6 7 8 9 10 11 12 13 14 15 |
SQL> select name, value from v$diag_info; NAME VALUE -------------------------- ----------------------------------------------------------------- Diag Enabled TRUE ADR Base /u01/app/ora12c ADR Home /u01/app/ora12c/diag/rdbms/orcl/orcl Diag Trace /u01/app/ora12c/diag/rdbms/orcl/orcl/trace Diag Alert /u01/app/ora12c/diag/rdbms/orcl/orcl/alert Diag Incident /u01/app/ora12c/diag/rdbms/orcl/orcl/incident Diag Cdump /u01/app/ora12c/diag/rdbms/orcl/orcl/cdump Health Monitor /u01/app/ora12c/diag/rdbms/orcl/orcl/hm Default Trace File /u01/app/ora12c/diag/rdbms/orcl/orcl/trace/orcl_ora_44126.trc Active Problem Count 0 Active Incident Count 0 |
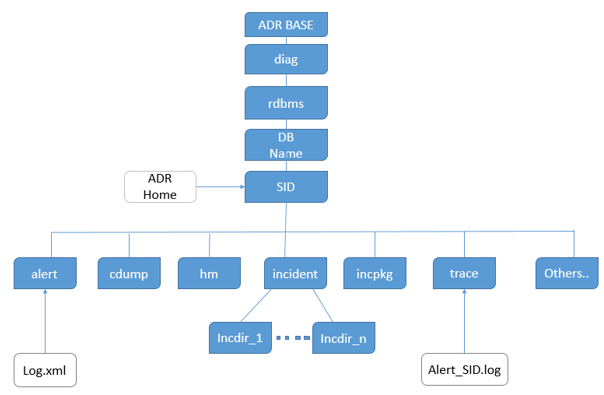
To understand easily, please look into below table
| Diagnostic data | ADR location |
| Foreground process traces | $ADR_HOME/trace |
| Background process traces | $ADR_HOME/trace |
| Incident dumps | $ADR_HOME/incident/incdir_n |
| Core dumps | $ADR_HOME/cdump |
| Alert log data | $ADR_HOME/trace & alert |
| DDL logs | $ADR_HOME/log/ddl (New feature in 12C) |
| Debug logs | $ADR_HOME/log/debug (New feature in 12C) |
Look into below flow chart to understand diagnostics directories location
Self-managing tasks by ADR that we need to know
- Trace files purged after 1 month (configurable)
- Incident/Problem metadata purged after 1 year (configurable)
- Note: Incident can be flagged as “don’t purge” to override purging
Repeated incidents are flood controlled (5 dumps per hour per problem)
- The ADR location is specified using the diagnostic_dest initialisation parameter. If you haven’t set yet then see below that how we can set ADR location:
-
123456SQL> alter system set diagnostic_dest='/u01/app/ora12c';System altered.SQL> show parameter diagnostic_destNAME TYPE VALUE------------------------------------ ----------- ------------------------------diagnostic_dest string /u01/app/ora12c
For the listener, the ADR location is set by editing the listener file to include the following entry.ADR_BASE_LISTENER= /u01/app/ora12c
To add this entry type below command and save the listener file.
1[ora12c@CentOS7 ~]$ vi $ORACLE_HOME/network/admin/listener.oraThe listener should be restarted for the change to take effect.
[ora12c@CentOS7 ~]$ lsnrctl stop
[ora12c@CentOS7 ~]$ lsnrctl start
Automatic Diagnostic Repository Command Interpreter (ADRCI)
The ADR Command Interpreter (ADRCI) is a command-line tool that we use to manage Oracle Database diagnostic data. ADRCI is a command-line tool that is part of the fault diagnosability infrastructure introduced in Oracle Database Release 11g. ADRCI enables:
- Viewing diagnostic data within the Automatic Diagnostic Repository (ADR).
- Viewing Health Monitor reports.
- Packaging of incident and problem information into a zip file for transmission to Oracle Support.
Diagnostic data includes incident and problem descriptions, trace files, dumps, health monitor reports, alert log entries, and more.
ADRCI has a rich command set, and can be used in interactive mode or within scripts. In addition, ADRCI can execute scripts of ADRCI commands in the same way that SQL*Plus executes scripts of SQL and PL/SQL commands.
To use ADRCI in interactive mode:
Set your environment properly, start ADRCI by issuing the command “adrci”
|
1 2 3 |
[ora12c@CentOS7 ~]$ . oraenv ORACLE_SID = [orcl] ? orcl The Oracle base remains unchanged with value /u01/app/ora12c |
|
1 2 3 4 5 6 |
[ora12c@CentOS7 ~]$ env | grep ORACLE ORACLE_UNQNAME=orcl ORACLE_SID=orcl ORACLE_BASE=/u01/app/ora12c ORACLE_HOSTNAME=CentOS7.localhost ORACLE_HOME=/u01/app/ora12c/product/12.1.0/dbhome_1 |
Start using ADRCI by following command :
|
1 2 3 4 5 6 7 8 9 10 11 12 |
[ora12c@CentOS7 ~]$ adrci ADRCI: Release 12.1.0.2.0 - Production on Sat Jan 19 12:31:45 2019 Copyright (c) 1982, 2014, Oracle and/or its affiliates. All rights reserved. ADR base = "/u01/app/ora12c" adrci> show homes ADR Homes: diag/rdbms/orcl/orcl diag/tnslsnr/CentOS7/listener adrci> |
In this case, any ADRCI command that you run, assuming that the command supports more than one current ADR home, works with diagnostic data from both ADR homes. If you were to set the home path to /diag/rdbms/orcl/orcl, only the ADR home for the instance with SID orcl would be current.
|
1 2 3 4 |
adrci> show homes ADR Homes: diag/rdbms/orcl/orcl diag/tnslsnr/CentOS7/listener |
Now set home path
|
1 2 3 4 5 |
adrci> set homepath diag/rdbms/orcl/orcl adrci> show homes ADR Homes: diag/rdbms/orcl/orcl adrci> |
In this case, any ADRCI command that you run would work with diagnostic data from this single ADR home only.
To get list of adrci command type help command as below:
|
1 2 3 4 5 6 7 8 9 10 11 12 13 14 15 16 17 18 19 20 21 22 23 24 25 26 27 28 29 30 31 32 33 34 35 |
adrci> help HELP [topic] Available Topics: CREATE REPORT ECHO EXIT HELP HOST IPS PURGE RUN SET BASE SET BROWSER SET CONTROL SET ECHO SET EDITOR SET HOMES | HOME | HOMEPATH SET TERMOUT SHOW ALERT SHOW BASE SHOW CONTROL SHOW HM_RUN SHOW HOMES | HOME | HOMEPATH SHOW INCDIR SHOW INCIDENT SHOW LOG SHOW PROBLEM SHOW REPORT SHOW TRACEFILE SPOOL SELECT There are other commands intended to be used directly by Oracle, type "HELP EXTENDED" to see the list |
As the help suggests, you can drill down by asking for help on specific commands.
|
1 2 3 4 5 6 7 8 9 10 11 12 13 14 15 16 17 18 19 20 21 22 23 24 25 26 27 28 29 30 31 32 33 34 35 36 37 38 39 40 41 42 43 44 45 46 47 48 49 50 51 52 53 54 55 56 |
adrci> help SHOW ALERT Usage: SHOW ALERT [-p <predicate_string>] [-term] [ [-tail [num] [-f]] | [-file <alert_file_name>] ] Purpose: Show alert messages. Options: [-p <predicate_string>]: The predicate string must be double-quoted. The fields in the predicate are the fields: ORIGINATING_TIMESTAMP timestamp NORMALIZED_TIMESTAMP timestamp ORGANIZATION_ID text(65) COMPONENT_ID text(65) HOST_ID text(65) HOST_ADDRESS text(17) MESSAGE_TYPE number MESSAGE_LEVEL number MESSAGE_ID text(65) MESSAGE_GROUP text(65) CLIENT_ID text(65) MODULE_ID text(65) PROCESS_ID text(33) THREAD_ID text(65) USER_ID text(65) INSTANCE_ID text(65) DETAILED_LOCATION text(161) UPSTREAM_COMP_ID text(101) DOWNSTREAM_COMP_ID text(101) EXECUTION_CONTEXT_ID text(101) EXECUTION_CONTEXT_SEQUENCE number ERROR_INSTANCE_ID number ERROR_INSTANCE_SEQUENCE number MESSAGE_TEXT text(2049) MESSAGE_ARGUMENTS text(129) SUPPLEMENTAL_ATTRIBUTES text(129) SUPPLEMENTAL_DETAILS text(4000) PROBLEM_KEY text(65) [-tail [num] [-f]]: Output last part of the alert messages and output latest messages as the alert log grows. If num is not specified, the last 10 messages are displayed. If "-f" is specified, new data will append at the end as new alert messages are generated. [-term]: Direct results to terminal. If this option is not specified, the results will be open in an editor. By default, it will open in emacs, but "set editor" can be used to set other editors. [-file <alert_file_name>]: Allow users to specify an alert file which may not be in ADR. <alert_file_name> must be specified with full path. Note that this option cannot be used with the -tail option Examples: show alert show alert -p "message_text like '%incident%'" show alert -tail 20 |
Viewing the Alert Log:
The alert log is written as both an XML-formatted file and as a text file. We can view either format of the file with any text editor, or we can run an ADRCI command to view the XML-formatted alert log with the XML tags stripped. By default, ADRCI displays the alert log in your default editor
The following are variations on the SHOW ALERT command:
|
1 |
adrci > SHOW ALERT -TAIL |
This displays the last portion of the alert log (the last 10 entries) in your terminal session.
|
1 |
adrci> SHOW ALERT -TAIL 50 |
This displays the last 50 entries in the alert log in your terminal session.
|
1 |
adrci> SHOW ALERT -TAIL -F |
This displays the last 10 entries in the alert log, and then waits for more messages to arrive in the alert log. As each message arrives, it is appended to the display. This command enables you to perform “live monitoring” of the alert log. Press CTRL-C to stop waiting and return to the ADRCI prompt.
If we want to filter the alert log file then we can filter as below:
===========================================================================
|
1 |
adrci> show alert -P "message_text LIKE '%ORA-600%'" |
ADR Home = /u01/app/ora12c/diag/rdbms/orcl/orcl:
Finding Trace Files:
ADRCI enables us to view the names of trace files that are currently in the automatic diagnostic repository (ADR). We can view the names of all trace files in the ADR, or we can apply filters to view a subset of names. For example, ADRCI has commands that enable us to:
- Obtain a list of trace files whose file name matches a search string.
- Obtain a list of trace files in a particular directory.
- Obtain a list of trace files that pertain to a particular incident.
The following statement lists the name of every trace file that has the string ‘mmon’ in its file name. The percent sign (%) is used as a wildcard character, and the search string is case sensitive.
|
1 2 3 4 5 6 |
adrci> SHOW TRACEFILE %mmon% diag/rdbms/orcl/orcl/trace/orcl_mmon_19128.trc diag/rdbms/orcl/orcl/trace/orcl_mmon_18663.trc diag/rdbms/orcl/orcl/trace/orcl_mmon_18491.trc diag/rdbms/orcl/orcl/trace/orcl_mmon_18480.trc diag/rdbms/orcl/orcl/trace/orcl_mmon_18407.trc |
Checking a particular trace file :
|
1 2 3 4 5 6 7 8 9 10 11 12 |
adrci> show trace /u01/app/ora12c/diag/rdbms/orcl/orcl/trace/orcl_ora_18171.trc Output the results to file: /tmp/utsout_60461_14000_5.ado /u01/app/ora12c/diag/rdbms/orcl/orcl/trace/orcl_ora_18171.trc ---------------------------------------------------------- LEVEL PAYLOAD ----- ------------------------------------------------------------------------------------------------------------------------------------------------ Trace file /u01/app/ora12c/diag/rdbms/orcl/orcl/trace/orcl_ora_18171.trc The alert log will often make reference to trace files. These can be viewed directly using the SHOW TRACE command. |
Automatically purging
Sometimes we are facing with space related issues due to the huge number of trace file generation. Automatic purging can help us in this situations if set short retention time for trace files.
The automatic purging runs on schedule defined in retention policy .To check current policy for home, we can use two methods:
|
1 2 3 4 5 6 7 8 9 10 11 12 |
adrci> show control ADR Home = /u01/app/ora12c/diag/rdbms/orcl/orcl: ************************************************************************* ADRID SHORTP_POLICY LONGP_POLICY LAST_MOD_TIME LAST_AUTOPRG_TIME LAST_MANUPRG_TIME ADRDIR_VERSION ADRSCHM_VERSION ADRSCHMV_SUMMARY ADRALERT_VERSION CREATE_TIME -------------------- -------------------- -------------------- ---------------------------------------- ---------------------------------------- ---------------------------------------- -------------------- -------------------- -------------------- -------------------- ---------------------------------------- 1335663986 720 8760 2019-01-18 16:49:26.771340 +05:30 1 2 82 1 2019-01-18 16:49:26.771340 +05:30 1 rows fetched |
Or
|
1 2 3 4 5 6 7 |
adrci> select SHORTP_POLICY,LONGP_POLICY from ADR_CONTROL; ADR Home = /u01/app/ora12c/diag/rdbms/orcl/orcl: ************************************************************************* SHORTP_POLICY LONGP_POLICY -------------------- -------------------- 720 8760 1 rows fetched |
The above command will show the shortp_policy and longp_policy and this policy can the changed as below:
By default retention is 720 hours for short policy and 8760 hours for long policy.
Short policy include the following files: (Trace files, Core dump files, Packaging information)
Long policy include the following files 🙁 Incident information, Incident dumps, Alert logs)
To change the retention policy :
|
1 2 |
adrci> set control (SHORTP_POLICY=240); --10 days adrci> set control (LONGP_POLICY=720); --30 days |
–check changes
|
1 2 3 4 5 6 7 |
adrci> select SHORTP_POLICY,LONGP_POLICY from ADR_CONTROL; ADR Home = /u01/app/ora12c/diag/rdbms/orcl/orcl: ************************************************************************* SHORTP_POLICY LONGP_POLICY -------------------- -------------------- 240 720 1 rows fetched |
Manual purging
To purge diagnostic data that is older than the amount of time (minutes) given in the purge command. For ex to purge diagnostic data that is over 1 day old (1440 minutes).
|
1 |
adrci> PURGE -age 1440 -type ALERT |
–You can also purge trace files as the same method:
|
1 |
adrci> PURGE -age 1440 -type TRACE |
To remove all data older than one minute use:
|
1 |
adrci> PURGE -age 1 -type ALERT |
|
1 2 3 4 |
adrci> SHOW ALERT ADR Home = /u01/app/ora12c/diag/rdbms/orcl/orcl: ************************************************************************ No alert log in selected home |
Problem:
A simpler solution is to display the problem from the command line directly using the SHOW PROBLEM command.
|
1 |
adrci> show problem |
Incident: The same problem can occur multiple times, so a single problem may result in multiple incidents. Incidents are displayed using the SHOW INCIDENT command.
|
1 |
adrci> show incident |