
Dear Readers,
In this article, we will see the following Internal mechanism of Buffer Cache.

Buffer cache management :
👉 Locating free blocks (Data to write)
👉 Finding data blocks (Data to read)
👉 Managing LRU lists (Flushing least recently used blocks)
👉 Cleaning dirty buffers
Searching Mechanism In Buffer Cache :
👉 How process will know block is cached?
👉 Will it search all existing blocks (some millions)?
👉 If cache size is higher (some gigs) how memory operation is fast?
Oracle internally calls Hashing algorithms to satisfy the output (Bucket#). To read the data process needs FILE#, Block#
Hash Algorithm of FILE#, BLOCK# = BUCKET#
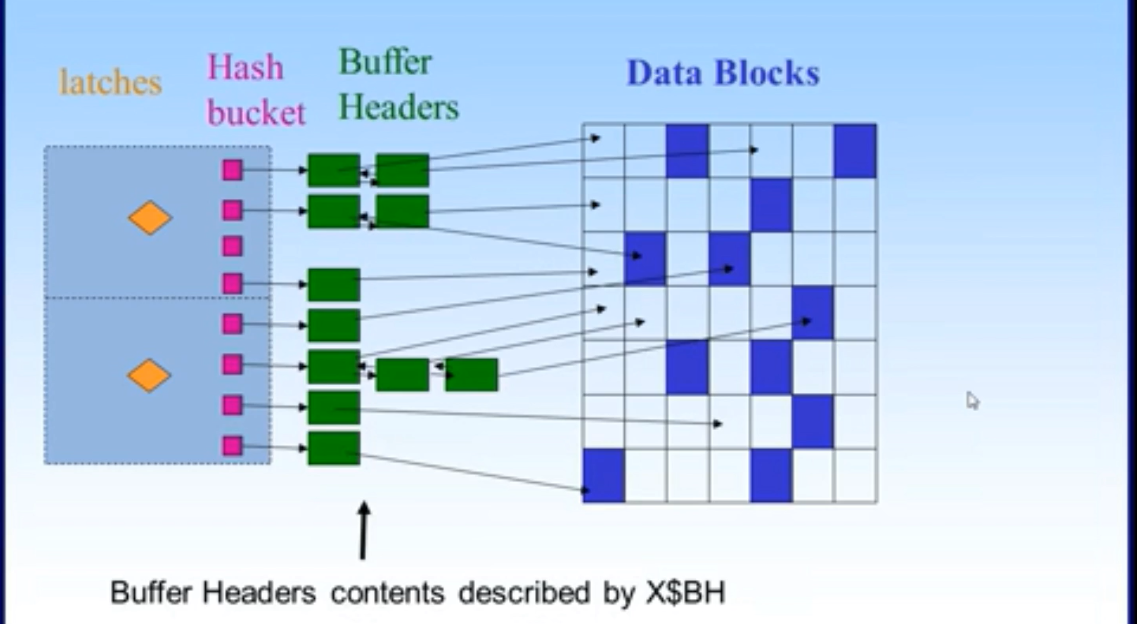
Buckets contains information of data blocks, Hash algorithm result will be unique and represents a bucket. Each bucket holds a chain of buffer headers points to exact Data Block.
Buffer header maintains information about data block it points to and the previous & next buffer header in the chain.
|
1 2 3 4 5 6 7 8 9 |
Name Type ------------ ----------- ADDR RAW(8) INDX NUMBER INST_ID NUMBER HLADDR RAW(8) BLSIZ NUMBER NXT_HASH RAW(8) PRV_HASH RAW(8) |
X$bh is the view related to know the information about Buffer Headers
|
1 2 3 4 5 6 7 8 9 |
Name Type ------------ ----------- ADDR RAW(8) INDX NUMBER INST_ID NUMBER HLADDR RAW(8) BLSIZ NUMBER NXT_HASH RAW(8) PRV_HASH RAW(8) |
Mechanism of Finding a Block :
👉 Hash the block address
👉 Get the bucket Latch
👉 Find the header
👉 Find the read block from cache
👉 Block not exists in cache read from Disk
Latch is the mandatory gateway (control mechanism) to access Hash Bucket. Until unless latch is not available to access bucket all the sessions has to wait in queue.
Latch Cache Buffer Chain :
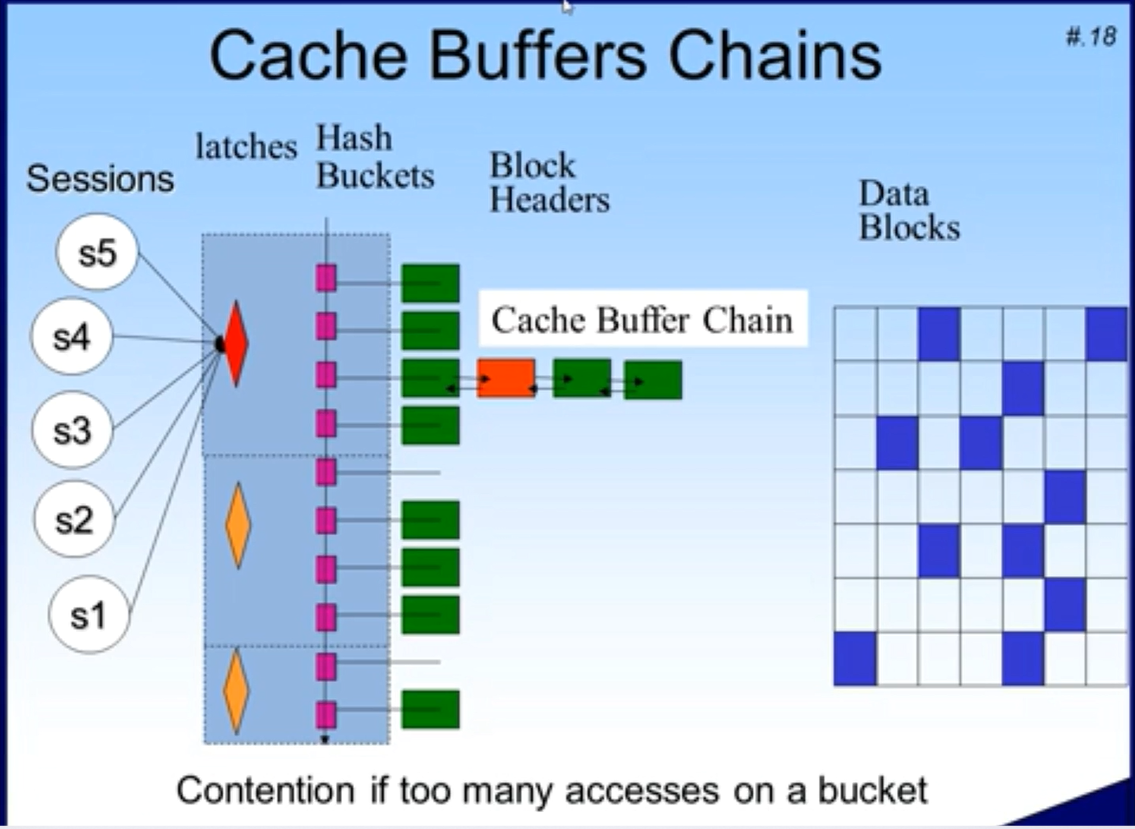
Chain of headers in a bucket called Cache Buffer Chain. From above E.g. 5 processes are trying for a latch but only one process at a time will get a latch and remaining wait until the latch cleared.
Cache Buffer Chain Solutions :
👉 Nested loop Statements
👉 Hash partition
👉 Uses hash joins
👉 Select from dual (Possibly use x$dual)
![]()
For suppose I’m running 40 sessions out of 40 most of the sessions require same block, we can question why this many sessions searching same block , same area?. Is data distributed properly or not?.
Select * from v$event_name where name like ’latch :cache buf%’;
P1 – Latch address
P2 – No. of concurrency
P3 – No. of tries
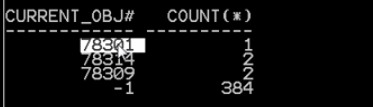
By using v$active_session_history we can easily identify which block of table has contention current_object#, current_file#, current_block#, current_row#
|
1 2 3 |
Select current_object#, count(*) from v$active_session_history where sample_time > ‘21-Dec-2020 6:00:00PM’ and event like ‘latch :cache buf%’ group by current_object#; |
Thank you for giving your valuable time to read the above information.
Follow us on
Website : www.ktexperts.com
Facebook Page : KTexperts
Linkedin Page : KT EXPERTS