Dear Readers,
In this article,we will see brief introduction on Amazon CloudWatch.
Amazon CloudWatch
Amazon CloudWatch is one of the most used services offered by Amazon.
Amazon CloudWatch is the component of Amazon Web Services that provides real-time monitoring of AWS resources and customer applications running on Amazon infrastructure.
CloudWatch collects monitoring and operational data in the form of logs, metrics, and events, providing you with a unified view of AWS resources, applications, and services that run on AWS and on-premises servers.
The CloudWatch home page automatically displays metrics about every AWS service you use.
You can additionally create custom dashboards to display metrics about your custom applications, and display custom collections of metrics that you choose.
You can create alarms which watch metrics and send notifications or automatically make changes to the resources you are monitoring when a threshold is breached.
Amazon CloudWatch allows you to create Dashboards which will display metrics as per your monitoring needs.
You can also create Alarms and take actions based on the thresholds. Notifications for the same can be triggered which can send emails to your mailbox.
Why Amazon CloudWatch?
There are so many tools and software available for monitoring different platforms and applications. Almost, each platform and software offers monitoring tools with it. But the root problem is that when you are using a handful of services, applications, and software then it becomes nearly impossible to install and manage different monitoring tools.
Here Amazon CloudWatch comes in picture. You don’t need to install and manage different monitoring tools for the service that you use. You have almost all metrics available starting from HTTP error codes to CPU usage.
Amazon CloudWatch Works?
Amazon Cloud watch is a service just like any other service on AWS. It stores all the monitoring related data and displays that data. In simple words, it’s a metrics repository. All of the services on AWS puts the monitoring data to this repository.

You can use metrics to calculate statistics and then present the data graphically in the CloudWatch console.
You can configure alarm actions to stop, start, or terminate an Amazon EC2 instance.
you can create alarms that initiate Amazon EC2 Auto Scaling and Amazon Simple Notification Service (Amazon SNS) actions
Amazon CloudWatch also allows you to create custom metrics which can be stored to metrics repository and retrieve the statistics data.
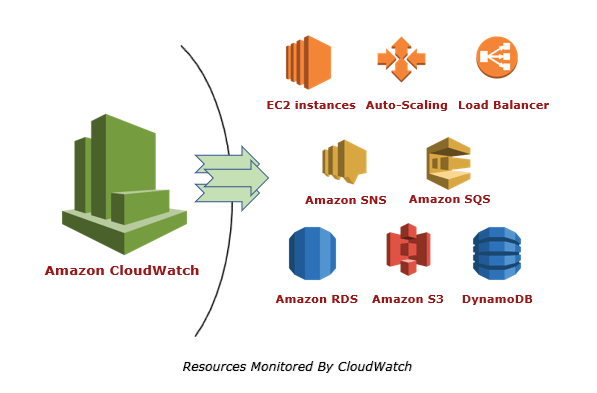
AWS resources monitored by Amazon CloudWatch.
Amazon CloudWatch Concepts
The following concepts need to your understanding and use of Amazon CloudWatch.
- Namespaces
- Metrics
- Dimensions
- Statistics
- Percentiles
- Alarms
Namespaces
A namespace is a container for CloudWatch metrics. Metrics in different namespaces are isolated from each other, so that metrics from different applications are not mistakenly aggregated into the same statistics.
There is no default namespace.
The AWS namespaces typically use the following naming convention: AWS/service.
Metrics
A metric represents a time-ordered set of data points that are published to CloudWatch.
For example, the CPU usage of a particular EC2 instance is one metric provided by Amazon EC2.
AWS services send metrics to CloudWatch, and you can send your own custom metrics to CloudWatch. You can add the data points in any order, and at any rate you choose.
Metrics exist only in the Region in which they are created. Metrics cannot be deleted, but they automatically expire after 15 months if no new data is published to them. Data points older than 15 months expire on a rolling basis; as new data points come in, data older than 15 months is dropped.
Metrics are uniquely defined by a name, a namespace, and zero or more dimensions. Each data point in a metric has a time stamp, and (optionally) a unit of measure. You can retrieve statistics from CloudWatch for any metric.
Time Stamps
Each metric data point must be associated with a time stamp. The time stamp can be up to two weeks in the past and up to two hours into the future. If you do not provide a time stamp, CloudWatch creates a time stamp for you based on the time the data point was received.
Time stamps are dateTime objects, with the complete date plus hours, minutes, and seconds (for example, 2016-10-31T23:59:59Z).
Dimensions
A dimension is a name/value pair that is part of the identity of a metric. You can assign up to 10 dimensions to a metric.
Dimensions help you design a structure for your statistics plan.
whenever you add a unique name/value pair to one of your metrics, you are creating a new variation of that metric.
AWS services that send data to CloudWatch attach dimensions to each metric. You can use dimensions to filter the results that CloudWatch returns. For example, you can get statistics for a specific EC2 instance by specifying the InstanceId dimension when you search for metrics
Statistics
Statistics are metric data aggregations over specified periods of time. CloudWatch provides statistics based on the metric data points provided by your custom data or provided by other AWS services to CloudWatch. Aggregations are made using the namespace, metric name, dimensions, and the data point unit of measure, within the time period you specify. The following table describes the available statistics.

Units
Each statistic has a unit of measure. Example units include Bytes, Seconds, Count, and Percent.
You can specify a unit when you create a custom metric. If you do not specify a unit, CloudWatch uses None as the unit. Units help provide conceptual meaning to your data.
Periods
A period is the length of time associated with a specific Amazon CloudWatch statistic. Each statistic represents an aggregation of the metrics data collected for a specified period of time. Periods are defined in numbers of seconds, and valid values for period are 1, 5, 10, 30, or any multiple of 60.
For example, to specify a period of six minutes, use 360 as the period value. You can adjust how the data is aggregated by varying the length of the period. A period can be as short as one second or as long as one day (86,400 seconds). The default value is 60 seconds.
Periods are also important for CloudWatch alarms.
Retention
Metrics data points are associated with the retention policy as well. Retention means that when this data would not be retained.
Data points with a period of:
- fewer than 60 seconds are available for 3 hours.
- 60 seconds (1 minute) are available for 15 days
- 300 seconds (5 minutes) are available for 63 days
- 3600 seconds (1 hour) are available for 455 days (15 months)
Aggregation
Amazon CloudWatch aggregates statistics according to the period length that you specify when retrieving statistics. You can publish as many data points as you want with the same or similar time stamps. CloudWatch aggregates them according to the specified period length. CloudWatch does not aggregate data across Regions.
Percentiles
A percentile indicates the relative standing of a value in a dataset.
Percentiles help you get a better understanding of the distribution of your metric data.
Alarms
You can use an alarm to automatically initiate actions on your behalf. An alarm watches a single metric over a specified time period, and performs one or more specified actions, based on the value of the metric relative to a threshold over time. The action is a notification sent to an Amazon SNS topic or an Auto Scaling policy. You can also add alarms to dashboards.
When creating an alarm, select a period that is greater than or equal to the frequency of the metric to be monitored.).
Alarm States
An alarm has the following possible states:
- OK – The metric or expression is within the defined threshold.
- ALARM – The metric or expression is outside of the defined threshold.
- INSUFFICIENT_DATA – The alarm has just started, the metric is not available, or not enough data is available for the metric to determine the alarm state.
Evaluating an Alarm
When you create an alarm, you specify three settings to enable CloudWatch to evaluate when to change the alarm state:
- Period is the length of time to evaluate the metric or expression to create each individual data point for an alarm. It is expressed in seconds. If you choose one minute as the period, there is one data point every minute.
- Evaluation Period is the number of the most recent periods, or data points, to evaluate when determining alarm state.
- Data points to Alarm is the number of data points within the evaluation period that must be breaching to cause the alarm to go to the ALARM The breaching data points don’t have to be consecutive, they just must all be within the last number of data points equal to Evaluation Period.
For each alarm, you can specify CloudWatch to treat missing data points as any of the following:
- notBreaching– Missing data points are treated as “good” and within the threshold,
- breaching– Missing data points are treated as “bad” and breaching the threshold
- ignore– The current alarm state is maintained
- missing– The alarm doesn’t consider missing data points when evaluating whether to change state
CloudWatch Dashboards
Amazon CloudWatch dashboards are customizable home pages in the CloudWatch console that you can use to monitor your resources in a single view, even those resources that are spread across different Regions. You can use CloudWatch dashboards to create customized views of the metrics and alarms for your AWS resources
CloudWatch Events
Amazon CloudWatch Events delivers a near real-time stream of system events that describe changes in Amazon Web Services (AWS) resources
CloudWatch Events responds to these operational changes and takes corrective action as necessary, by sending messages to respond to the environment, activating functions, making changes, and capturing state information.
You can configure the following AWS services as targets for CloudWatch Events:
- Amazon EC2 instances
- AWS Lambda functions
- Streams in Amazon Kinesis Data Streams
- Delivery streams in Amazon Kinesis Data Firehose
- Log groups in Amazon CloudWatch Logs
- Amazon ECS tasks
- Systems Manager Run Command
- Systems Manager Automation
- AWS Batch jobs
- Step Functions state machines
- Pipelines in CodePipeline
- CodeBuild projects
- Amazon Inspector assessment templates
- Amazon SNS topics
- Amazon SQS queues
Concepts
Before you begin using CloudWatch Events, you should understand the following concepts:
Events – An event indicates a change in your AWS environment
Rules – A rule matches incoming events and routes them to targets for processing. A single rule can route to multiple targets, all of which are processed in parallel. Rules are not processed in a particular order.
Targets – A target processes events.
A target receives events in JSON format.
Amazon CloudWatch Limits

Advantages of Amazon CloudWatch
One dashboard, Access all data
The web applications produce a lot data as they are highly distributed, to access all the data which have been collected you just need a single CloudWatch dashboard.
Visibility on the complete Infrastructure
You can see through all the AWS resources and services you use, so you can correlate and contradict data produced from multiple services.
Improve total cost of ownership
CloudWatch can be used to set high resolution alarms and can take automated actions while there is an breach in the limits provided. This can help in minimize the costs spent on AWS services
Insights from logs
You receive detailed insights on separate AWS services and the applications you run on the infrastructure. Data like memory, CPU utilization, and capacity utilization can be monitored and receive insights from it
Optimize Applications and resources
Using the log and metric data, you can optimize your AWS services to provide maximum throughput and performance.
Thank you for giving your valuable time to read the above information.
Thank you for giving your valuable time to read the above information. Please click here to subscribe for further updates
KTEXPERTS is always active on below social media platforms.
Facebook : https://www.facebook.com/ktexperts/
LinkedIn : https://www.linkedin.com/company/ktexperts/
Twitter : https://twitter.com/ktexpertsadmin
YouTube : https://www.youtube.com/c/ktexperts
Instagram : https://www.instagram.com/knowledgesharingplatform