
Dear Readers,
In this article,we will see Create Amazon CloudWatch for Linux Server in AWS .

Launch Linux server
Please check below link to create Linux Server.
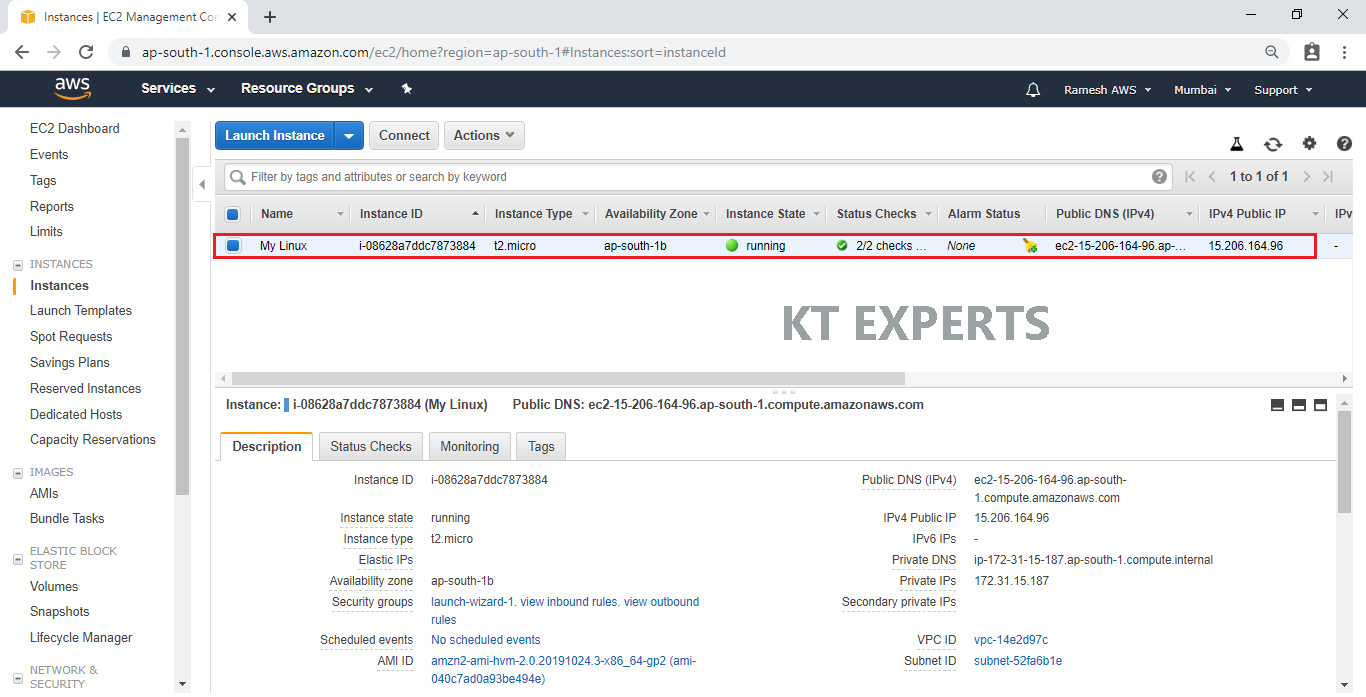
We can see Linux Server “My Linux” which was created earlier.
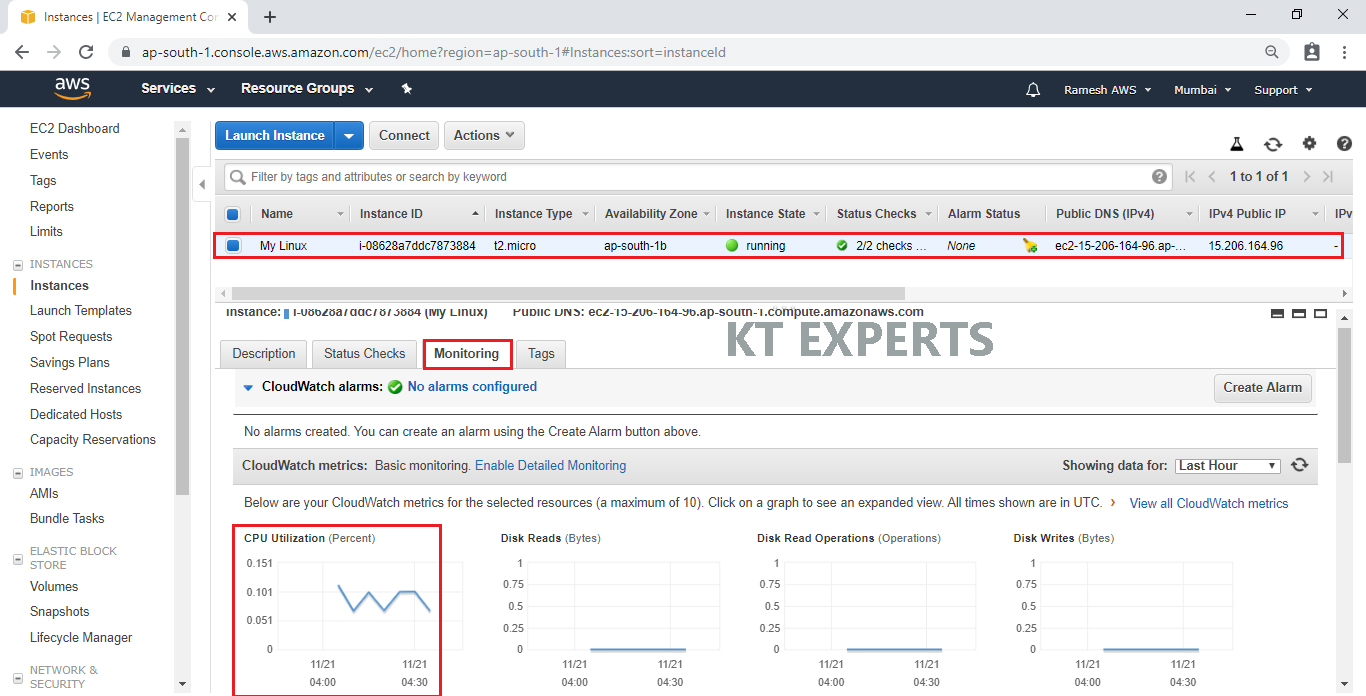
In the Monitoring, we can see different types of graphs.
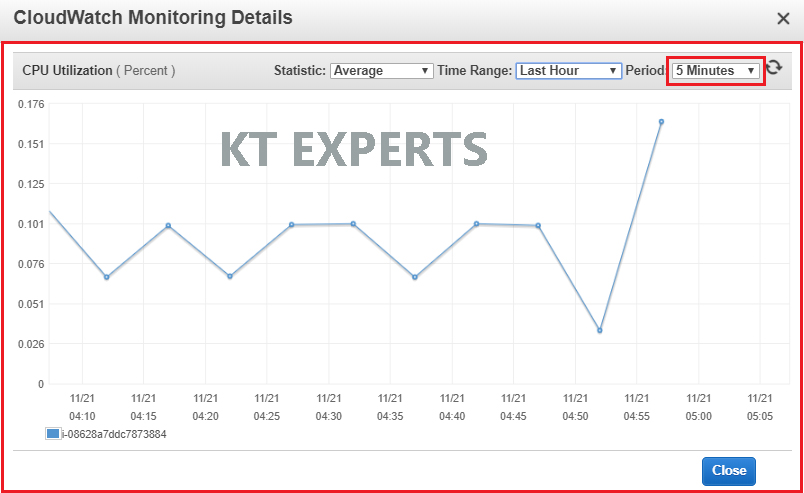
Once open CPU Utilization graph, we can see all the details like statistics, Time Range and Period.
It will captured data of your server for every 5 minutes.
We called as default Monitoring (Every minutes).
Note
If you reduce the time you will get more accurate data.
Default Monitoring for every five minutes (Free).
Detail Monitoring for every one minute (Need to pay).
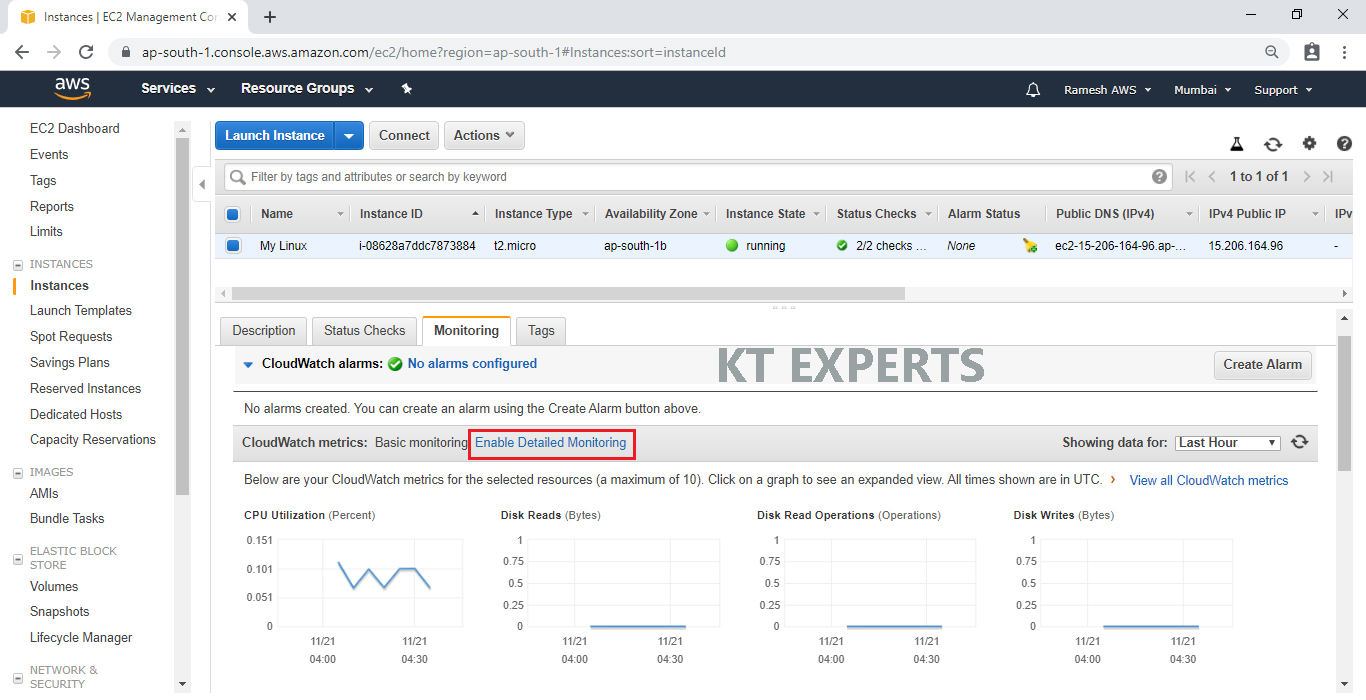
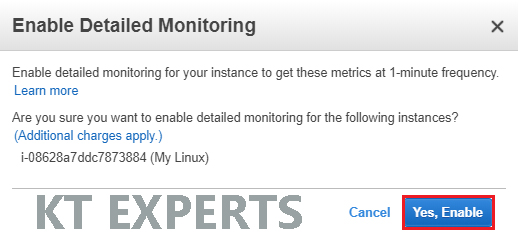
Enable Detailed Monitoring
Once enable “Enable Detailed Monitoring” you will get the data for every one minute.
Click on Yes, Enable.
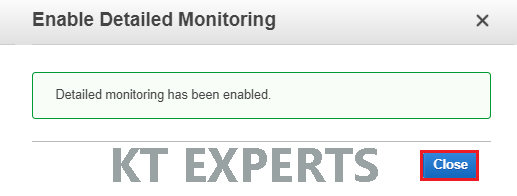
The Detailed monitoring has been enabled and click on close.
Now onwards it will be captured the data for every one minute.
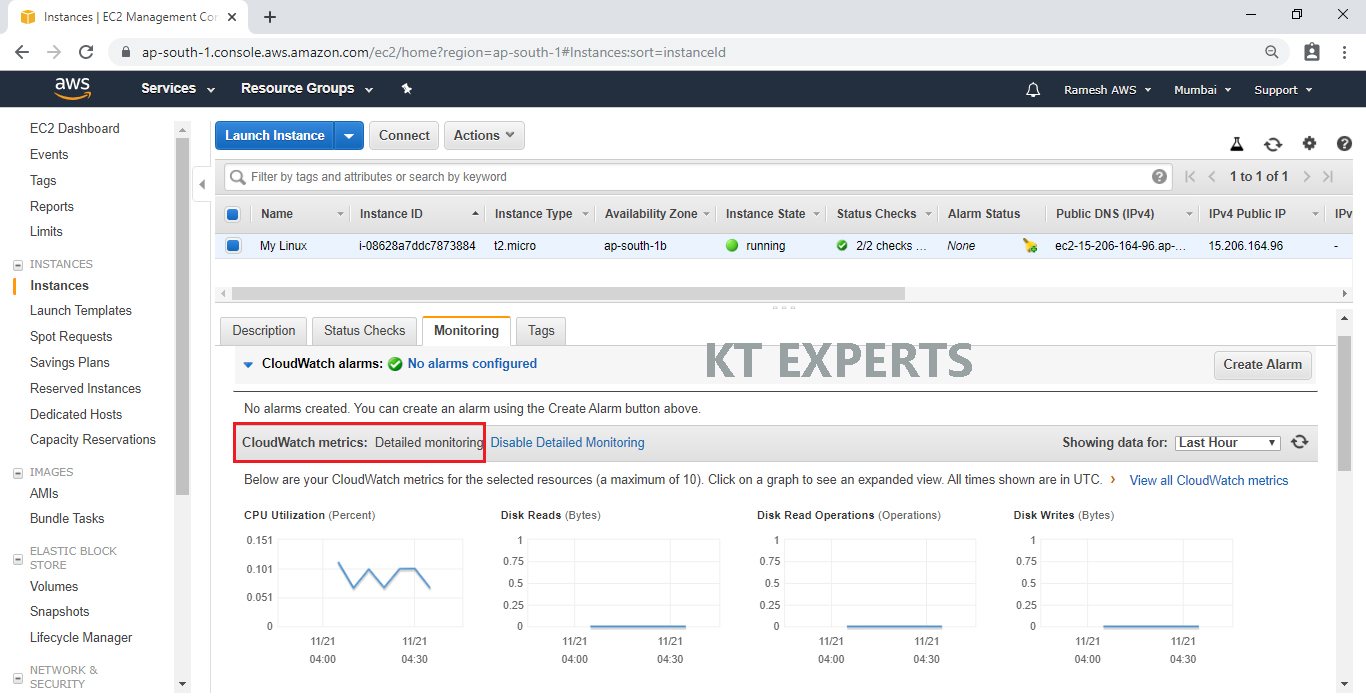
As of now it is monitoring your data for every one minute.
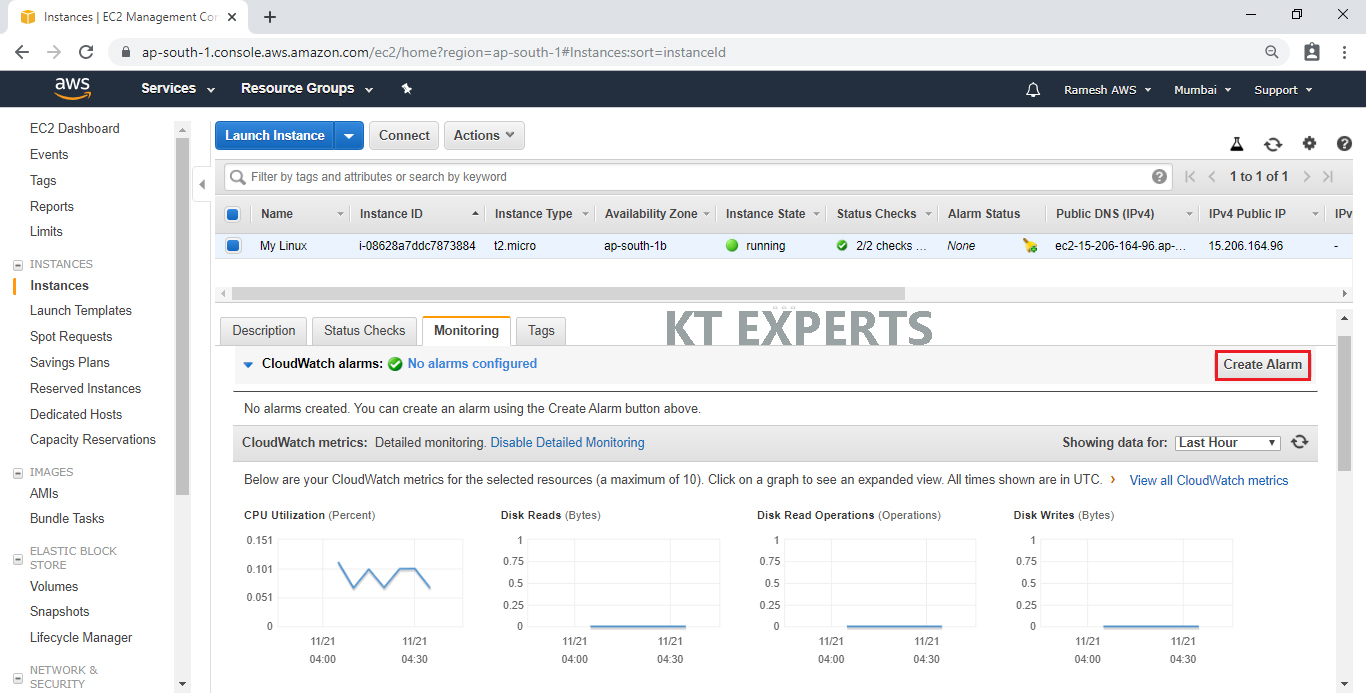
If you want to get notification, you have to create Alarm.
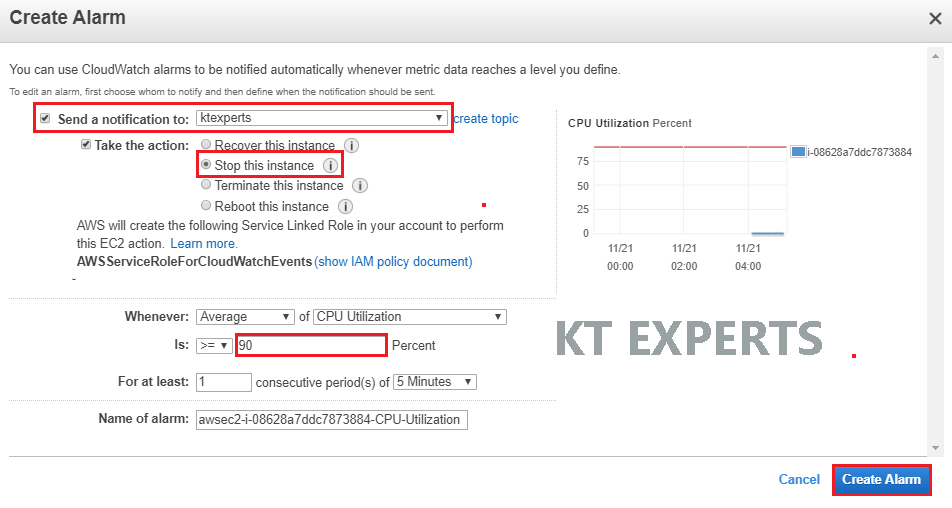
Create Alarm
Click on Create Alarm.
Whenever Average of CPU Utilization is more than 90 % for a at least one consecutive period of 5 minutes you will get one notification to you mail which was mentioned in SNS(Simple Notification Service).
CPU Utilization is more than 90 % for a at least one consecutive period of 5 minutes it stops the server automatically.
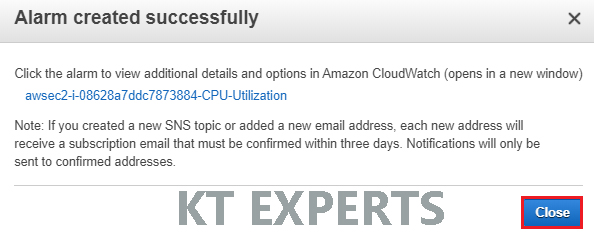
The Alarm has been created successfully and click on Close.
Click on CloudWatch metrics.
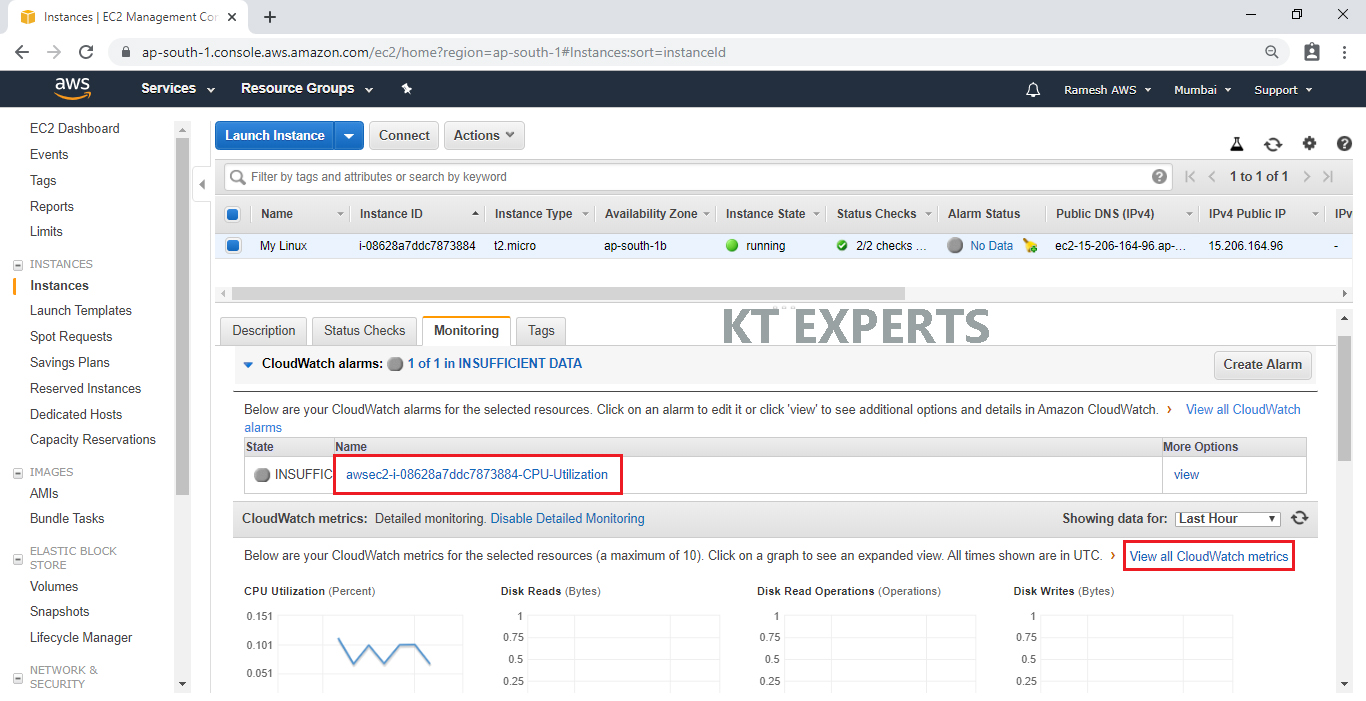
It will redirected to CloudWatch Alarm page and click on ok.
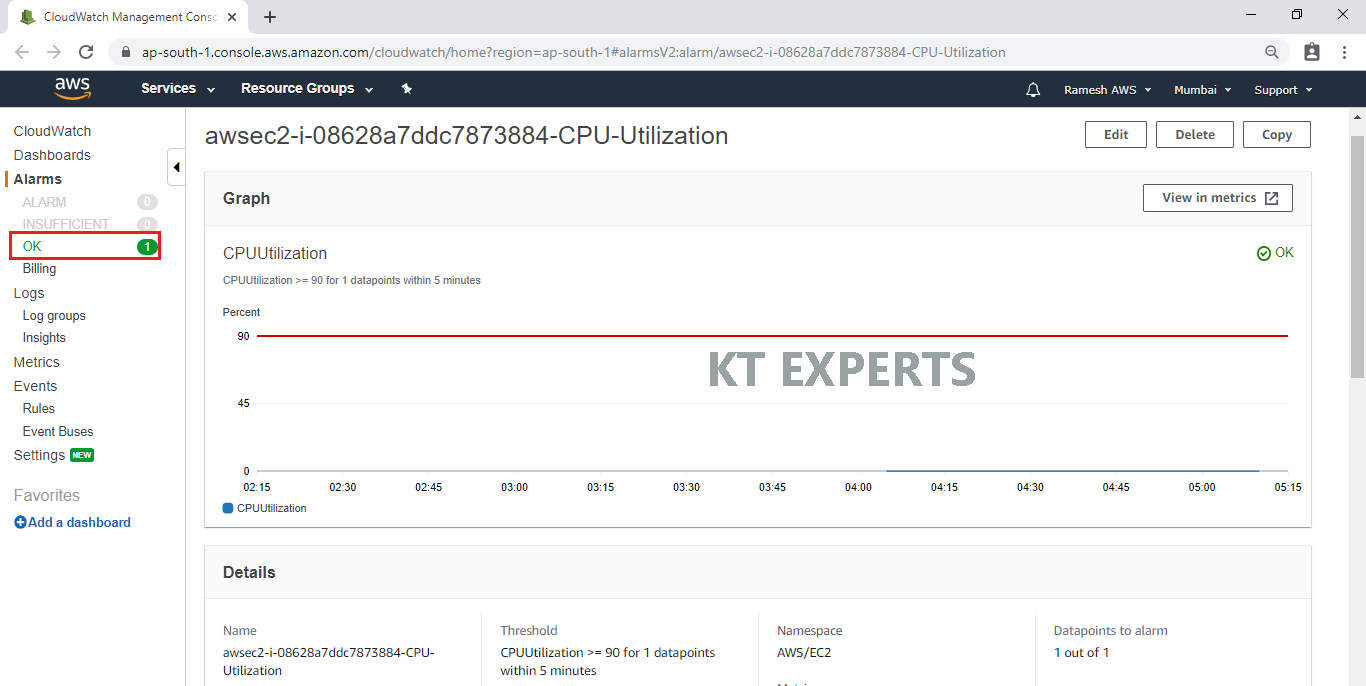
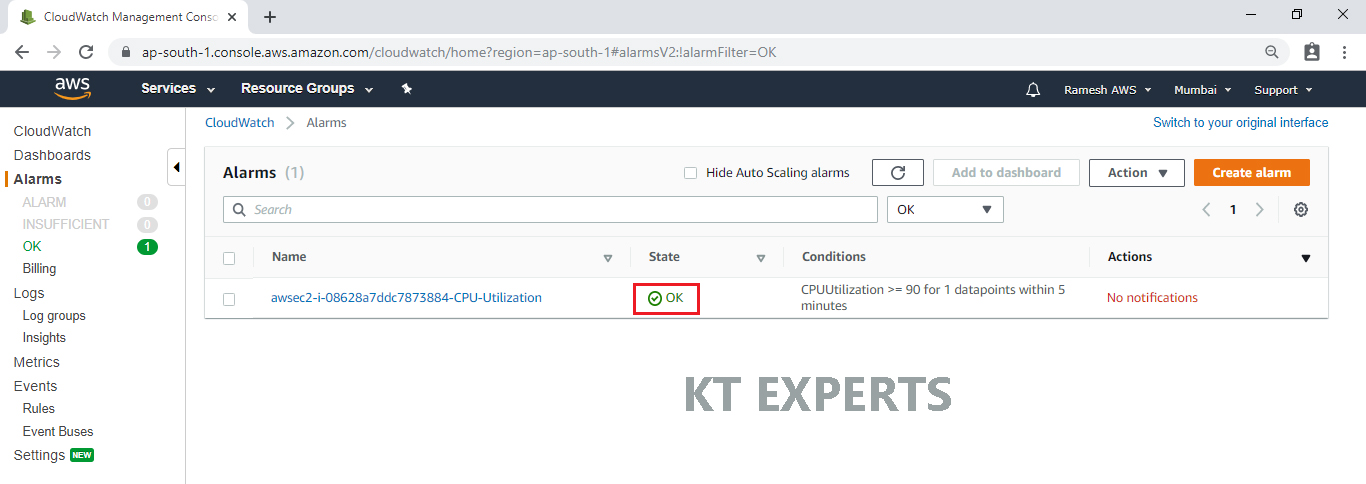
We can see the created Alarm.
Currently, the Alarm status is in Ok means everything is in our control.
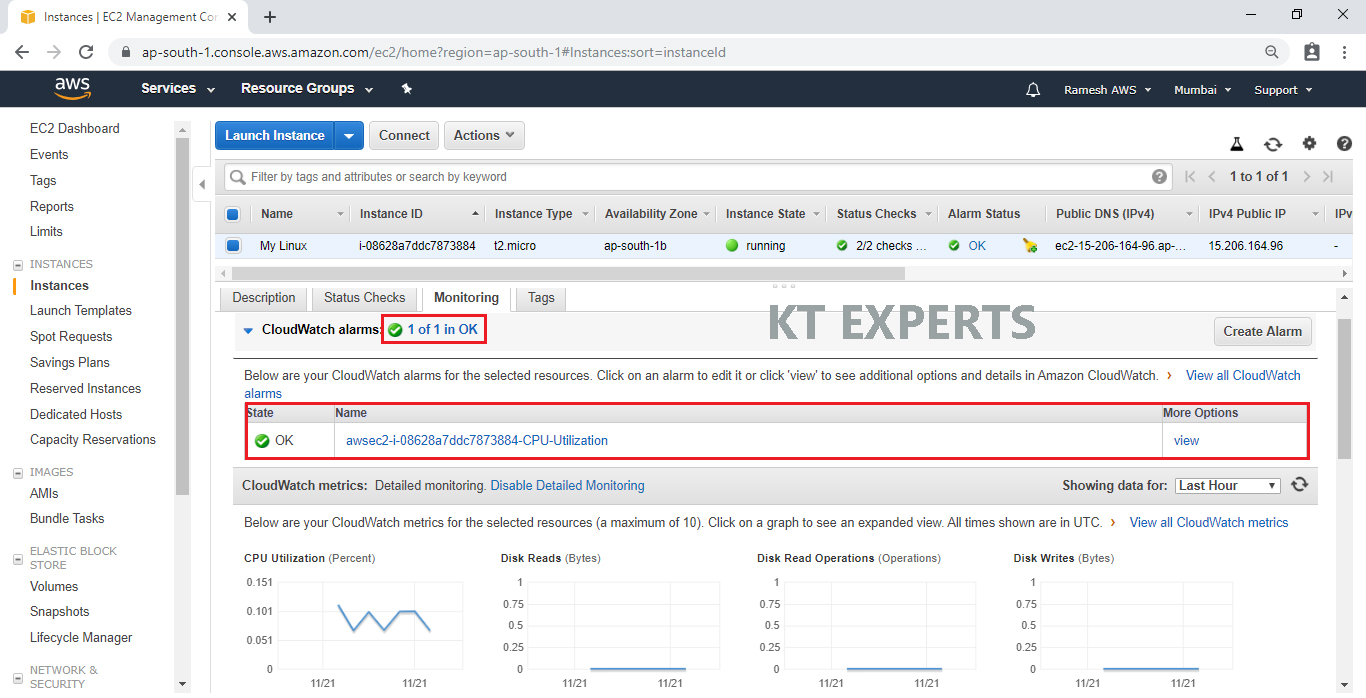
We can see Alarm in Monitoring tab.
Note
Here, we can see so many graphs.
These are all Lane graphs.
If you want to create different graphs or particular graph that to different model, you have to create CloudWatch dashboard.
Create Cloud Watch Dashboard
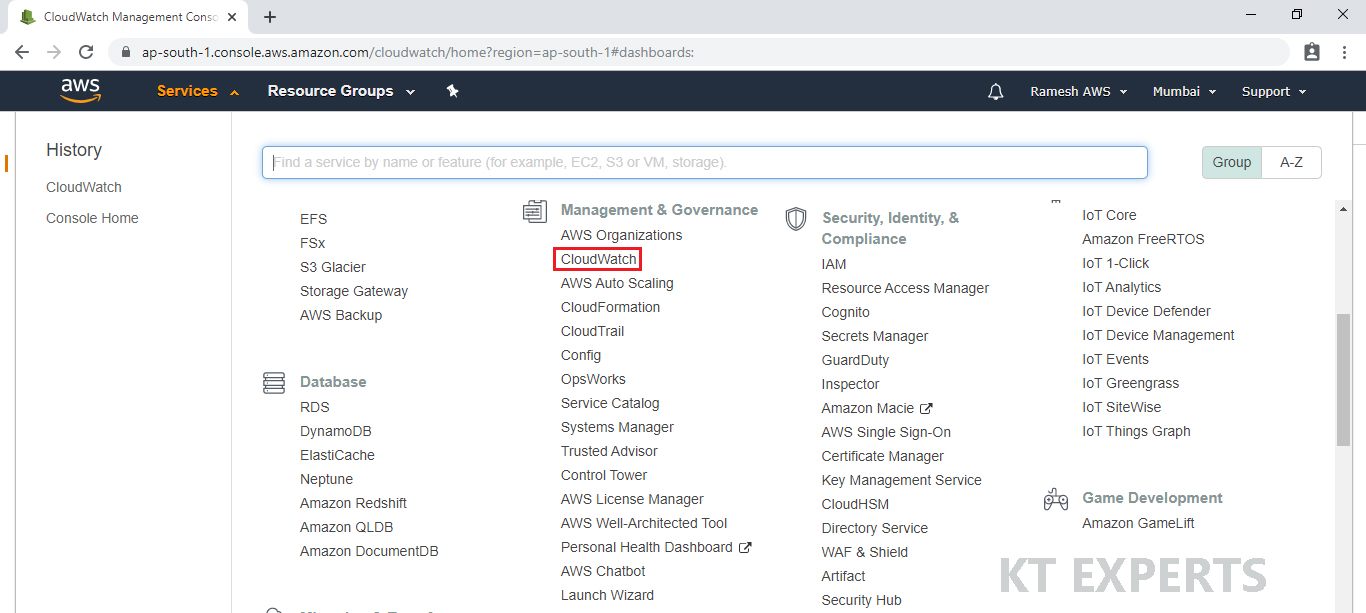
Go to Services, Click on CloudWatch in the Monitoring & Compliance Module.
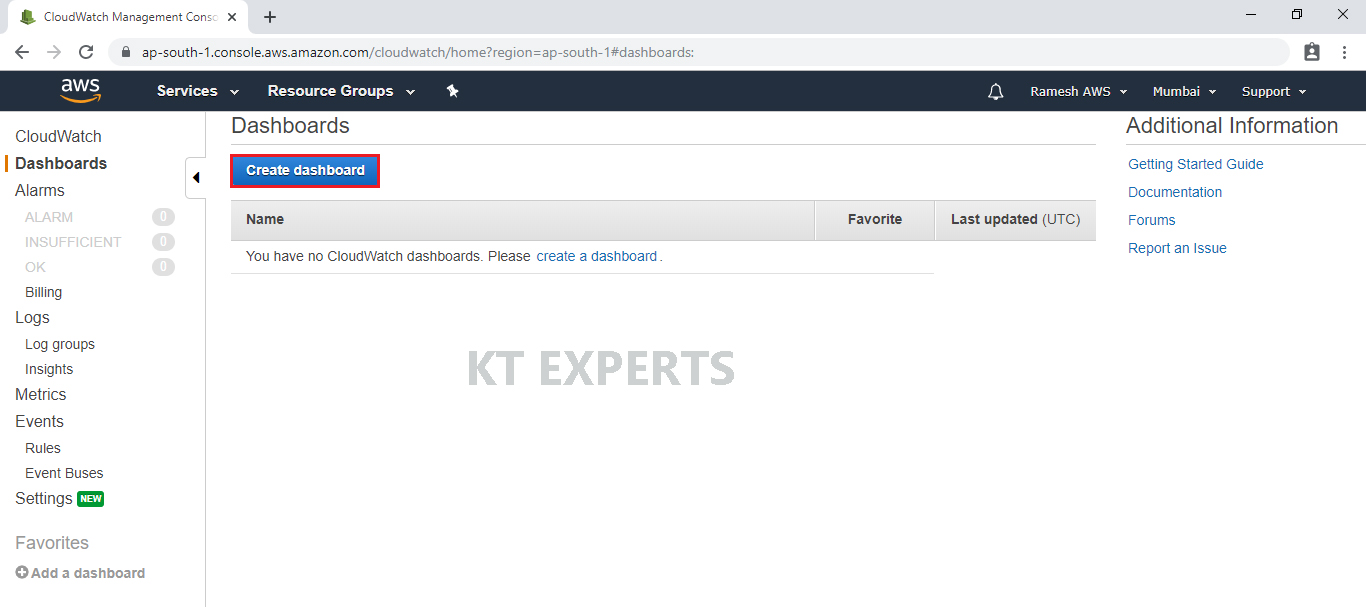
Click on Create dashboard.
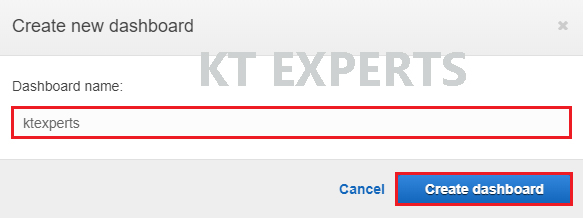
Specify Dashboard name “ktexperts” and click on create dashboard.
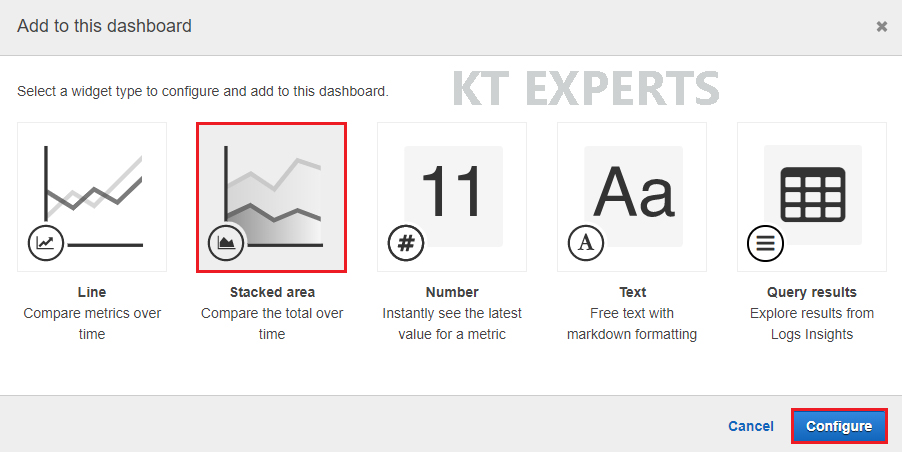
Select widget which want you required and click on configure.
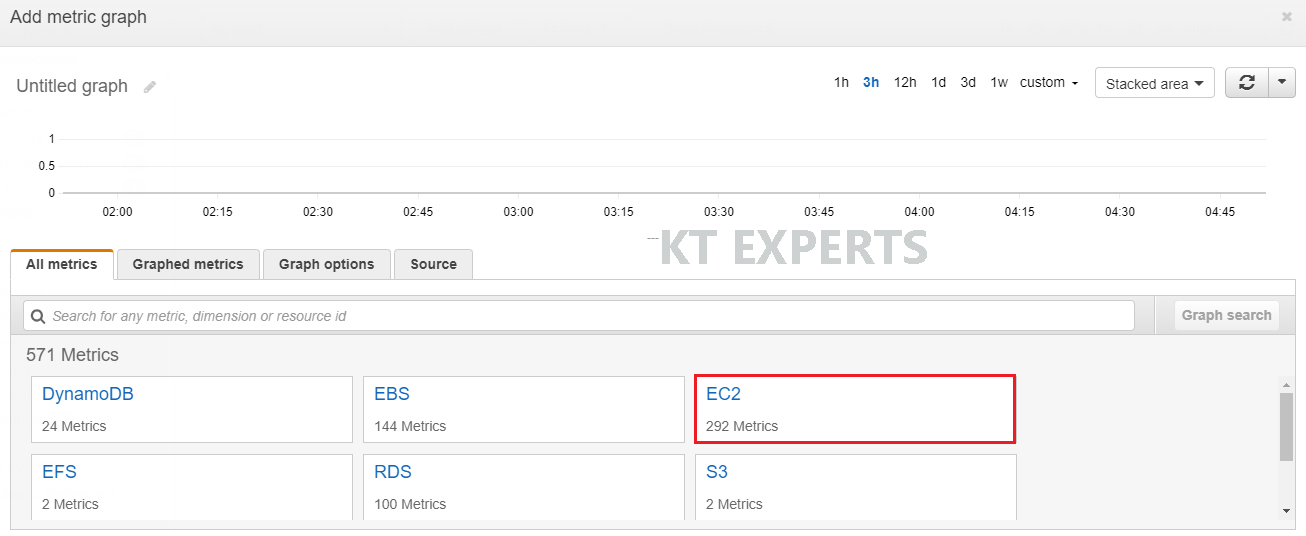
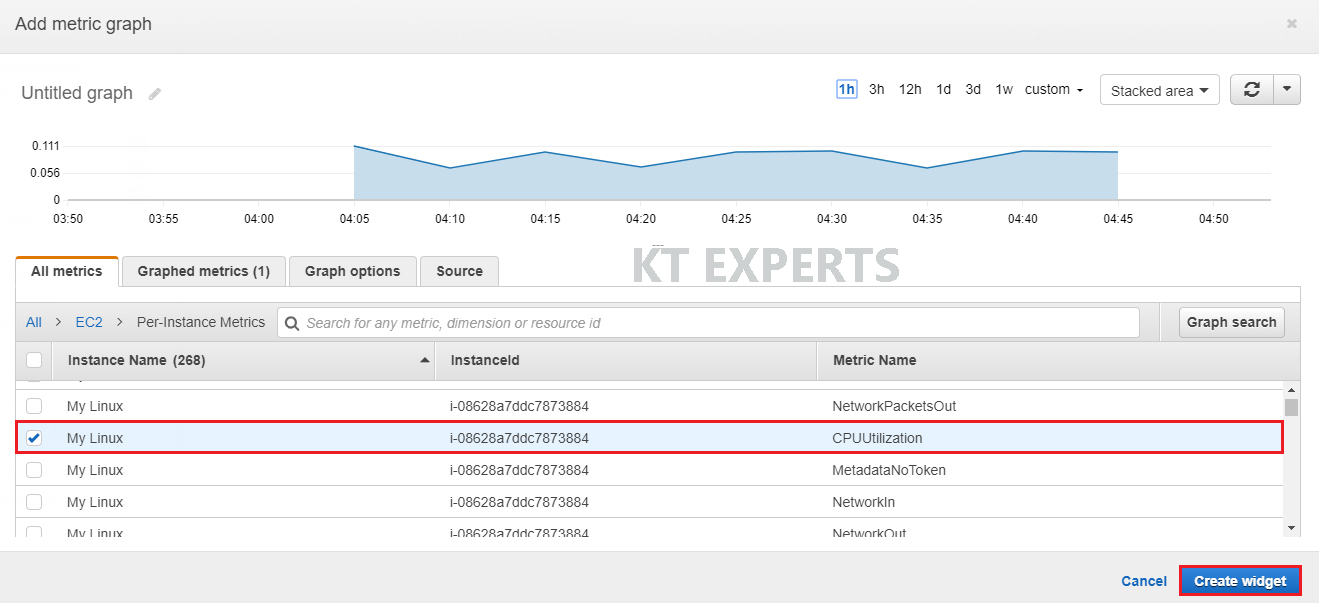
Add Metric
Select and click on EC2 to open.
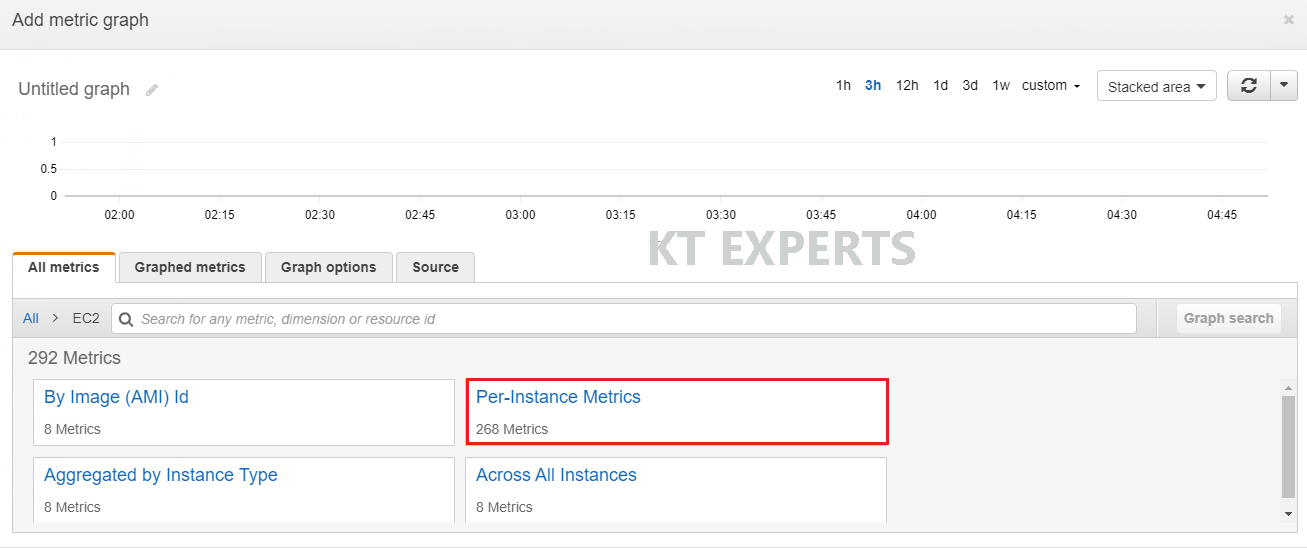
Click on Per-Instance Metrics
Select CPU Utilization Metric and click on create widget.
We can see Metric graph belongs to CPU Utilization.
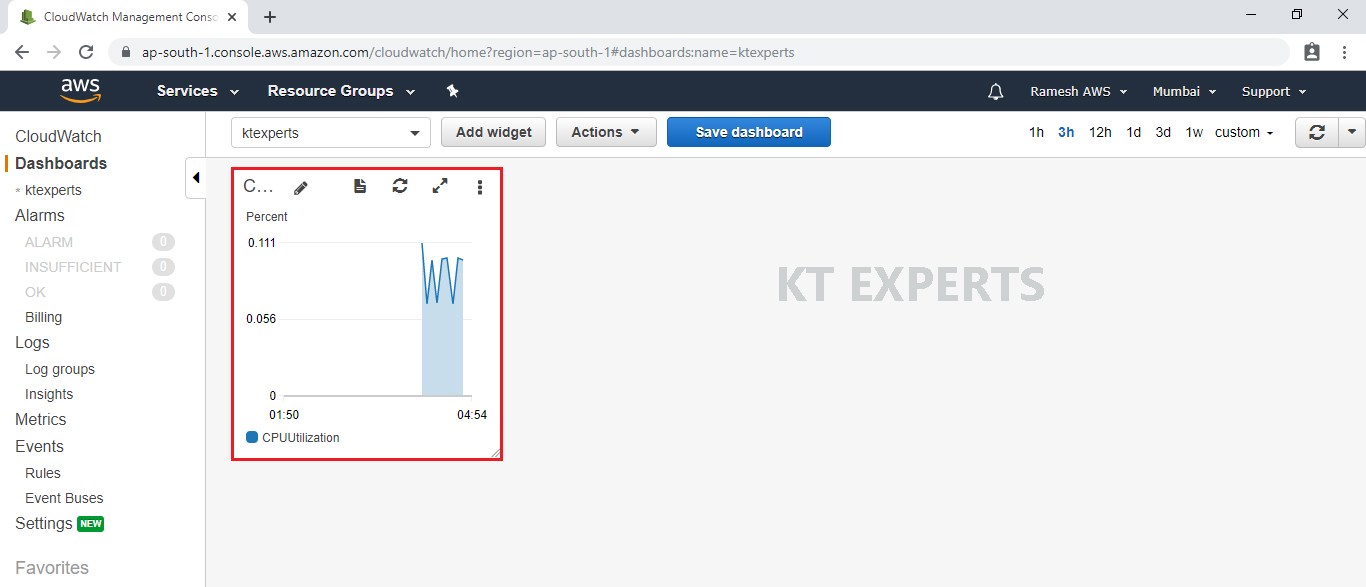
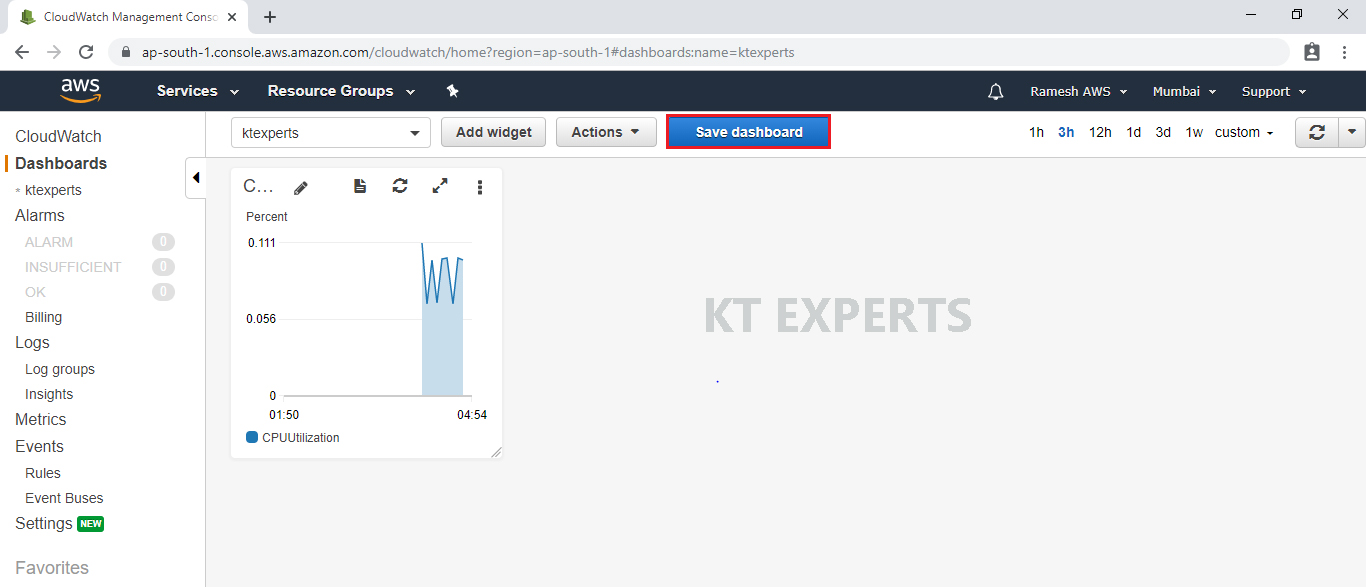
Click on save dashboard to save metric graph.
The metric graph has been saved successfully.
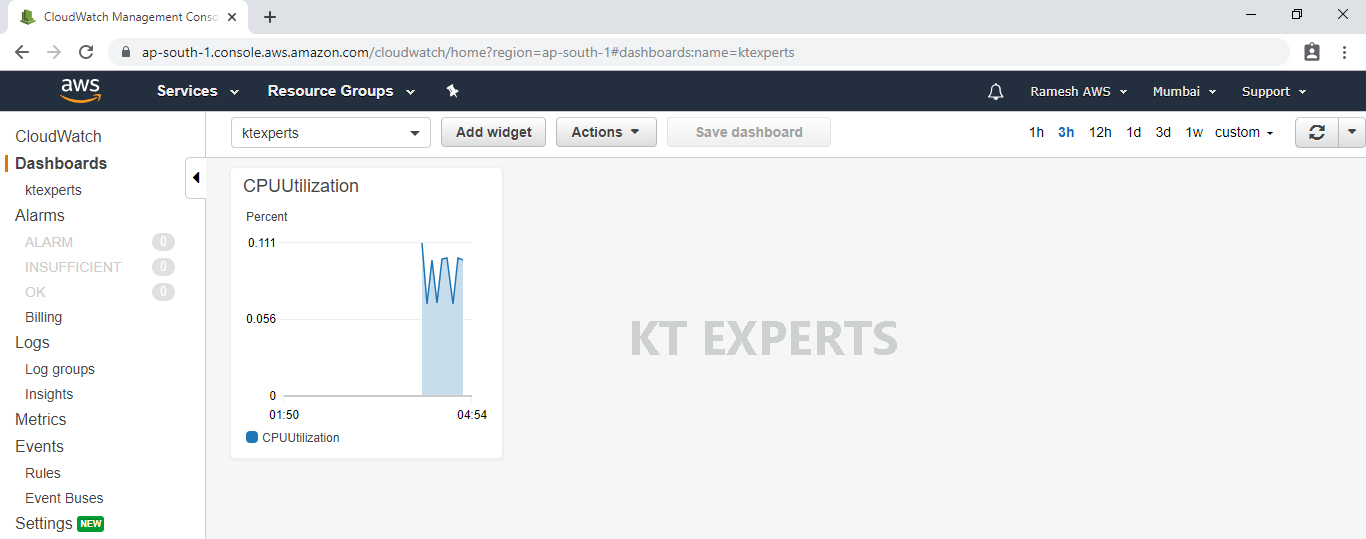
Now onwards, we can see the CPU Utilization for every one minute in the CloudWatch Dashboard.
Thank you for giving your valuable time to read the above information. Please click here to subscribe for further updates
KTEXPERTS is always active on below social media platforms.
Facebook : https://www.facebook.com/ktexperts/
LinkedIn : https://www.linkedin.com/company/ktexperts/
Twitter : https://twitter.com/ktexpertsadmin
YouTube : https://www.youtube.com/c/ktexperts
Instagram : https://www.instagram.com/knowledgesharingplatform